Support Titan > Titan Web > Elements > Charts > Graphs > Bar Chart > Bar Chart Settings > Chart Details
Do you like this
feature?
If you like this feature and want to transform your business with Titan's zero code applications for Salesforce, then schedule a demo today!
Related
Chart Details
Business Background
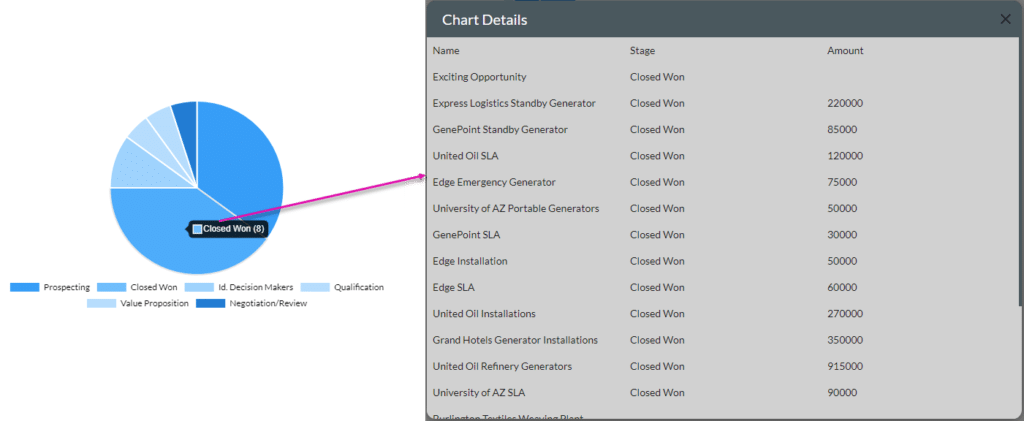
The Chart Details option is available for the Chart element. This option allows you to view more details from Salesforce of a specific data point. The detailed data is shown in a table in a pop-up modal.
How to Video
- 0:01 Introduction.
- 0:10 We show you how to create a chart.
- 0:49 Learn how to enable chart details.
- 1:08 We show you how to configure conditions.
- 1:38 Learn how to set the mapping.
- 2:13 View chart details.
- 3:45 We show you alternative condition options.
How to Guide
Note:
Learn more about charts.
- Click the + icon to open the list of elements.
- Select the Chart option from the list.
- Click-and-drag the Pie Chart element to the canvas.
- Configure the Pie Chart:
- Select a source in Salesforce.
- Configure conditions.
- Do the mapping.
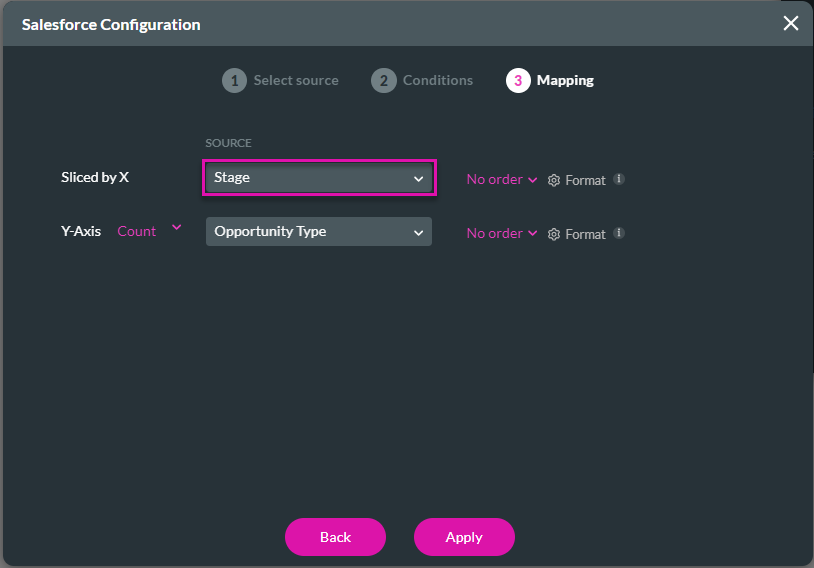
- In this example, the chart was sliced by X = Stage.
- This is important when you configure the chart details.
- Click the Apply button.
- Click the Pie Chart element settings Gear icon. The Pie Chart Settings screen opens.
- Select the Interactivity option.
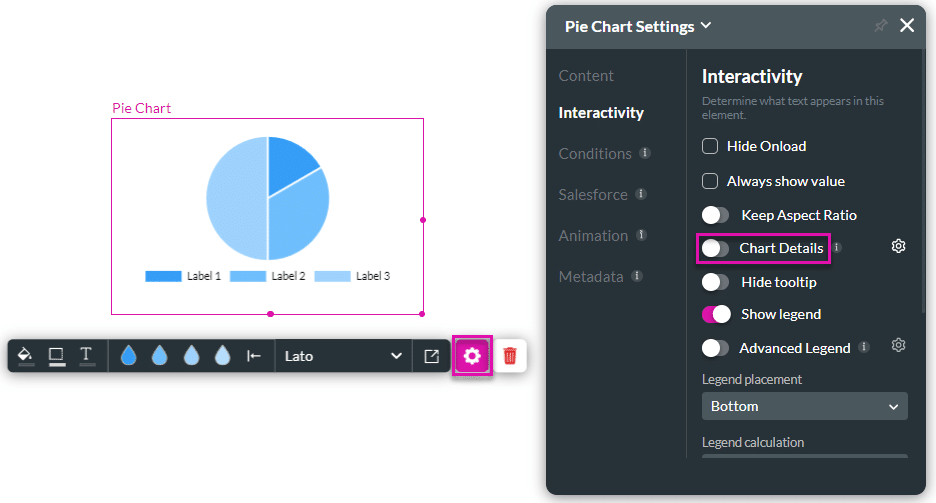
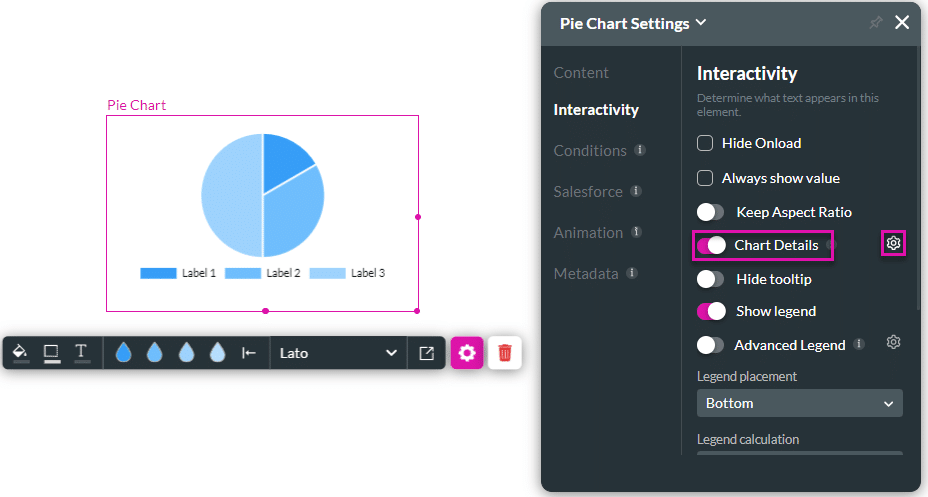
- Use the Chart Details toggle switch to enable the details. The option is, by default, off.
- Click the Chart Details Gear icon. The Salesforce Configuration screen opens.
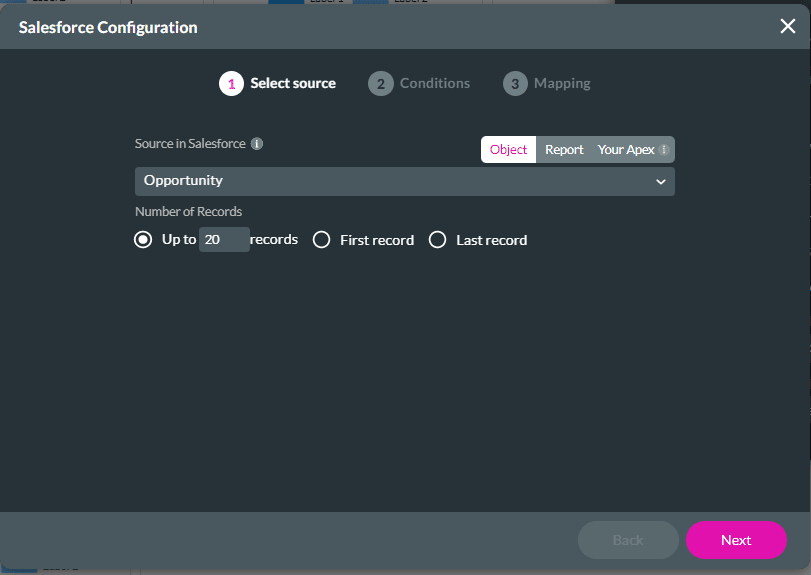
- View the source in Salesforce, and click the Next button.
- Add a condition that uses the selected chart.
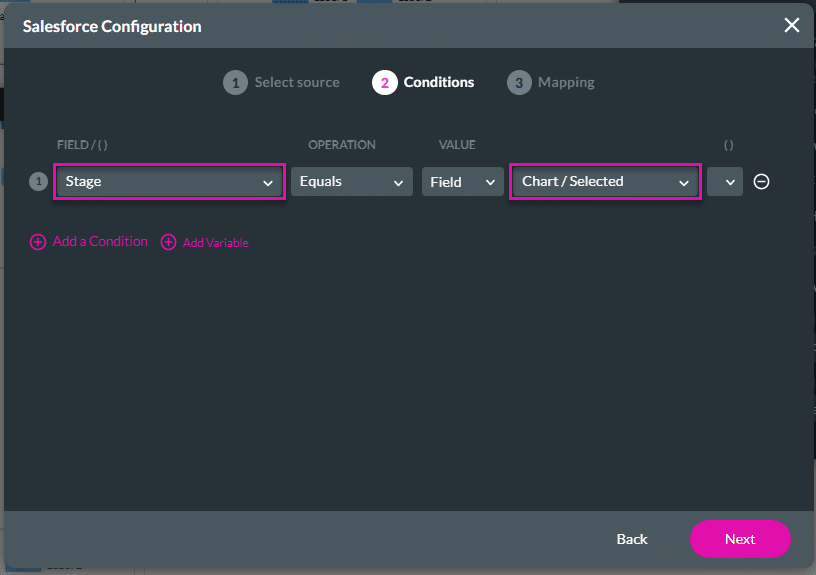
Note:
This condition must use the same source that you used when you set up the chart. In this example, the chart was sliced by X = Stage:

- Click the Next button and add the mapping for the detailed view.
- These are the fields of the record of the additional information that will be displayed in the modal.
- Click the Apply button.
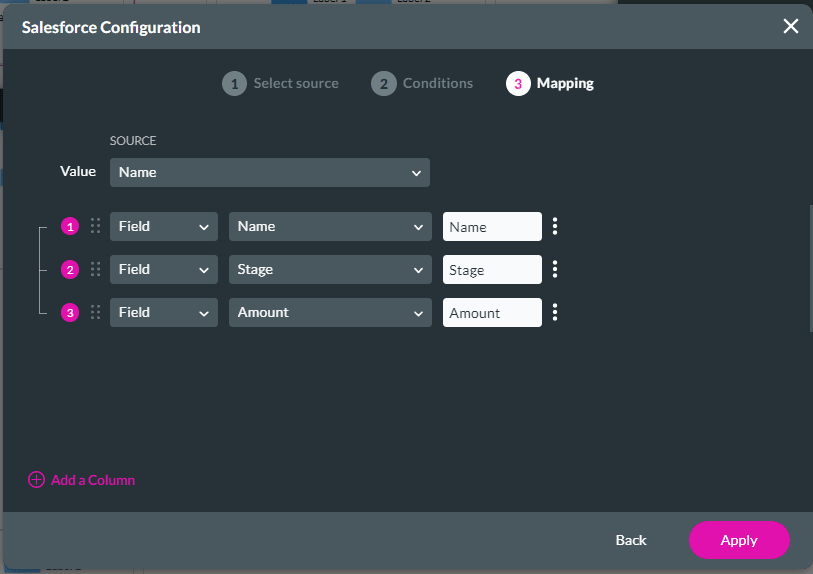
The chart details will be shown in a modal
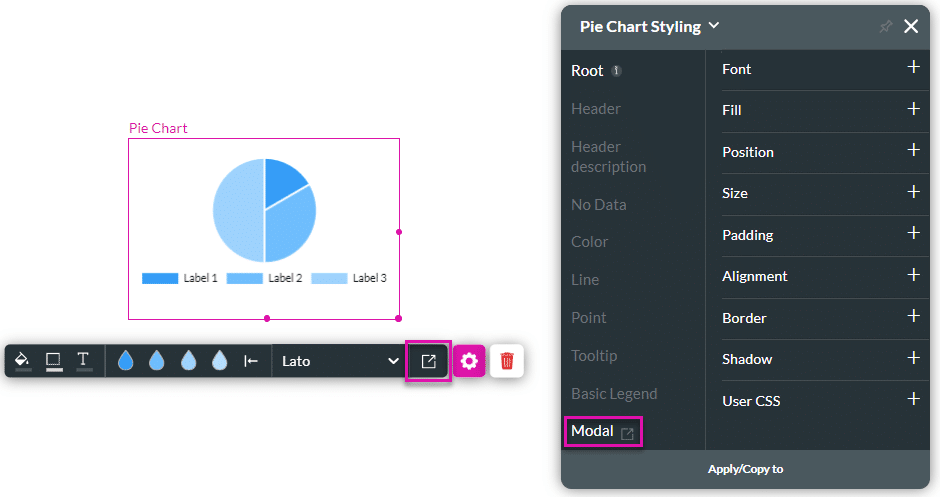
- Click the Styling icon of the chart. The Styling screen opens.
- Click the Modal option. The Customize Confirmation Pop Up screen opens.
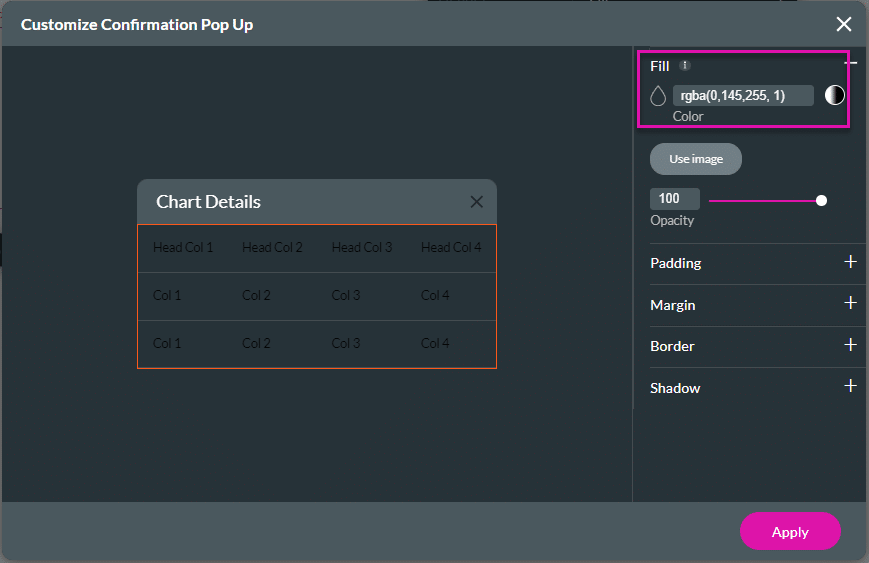
- Change the Fill of the chart to a lighter color.
- Click the Apply button.
- Save and Preview the project.
- Click a section of the chart. The modal with the chart details pops up.
Learn how to show more chart details in a power table.
You may also be interested in:
Hidden Title
Was this information helpful?
Let us know so we can improve!
Need more help?
Book Demo

