

Doughnut Chart
Business Background
Doughnut charts are primarily used to display data in a circular format and show the relationship of parts to a whole. Here are a few of the common uses of doughnut charts:
- Part-to-Whole Relationships: Doughnut charts are effective in illustrating the proportion of each component to the total. Each segment represents a portion of the whole, and the size of each segment is proportional to the quantity it represents.
- Percentage Distribution: Doughnut charts are useful for showing the distribution of percentages within a total. For example, you might use a doughnut chart to display the percentage distribution of sales across different product categories.
- Multiple Data Sets: Doughnut charts can be used to compare part-to-whole relationships across multiple data sets. Each part of the ring in the doughnut chart represents a different dataset, allowing for easy comparison.
Titan Solution
With Tian Web, you can configure a doughnut chart with data from your Salesforce.
How to Guide
- Click the + icon to open the list of elements.
- Select the Chart option from the list.
- Click-and-drag the Doughnut Chart element to the canvas.
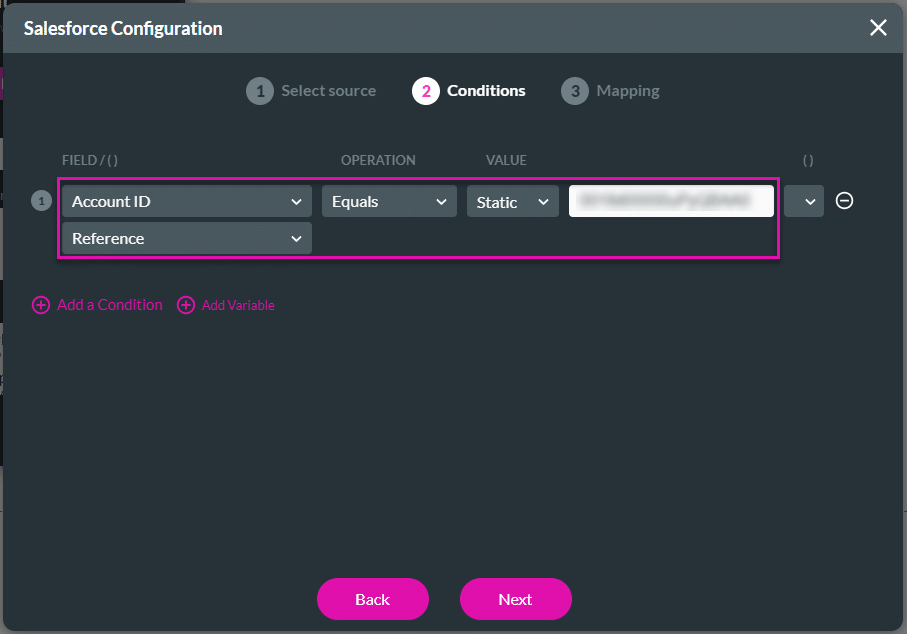
- Use the drop-down list to select a source in Salesforce and click the Next button.

- Use the drop-down lists to configure a condition as necessary.
- Use the Source drop-down list to configure the mapping of the X-axis as necessary.
- Use the drop-down list to configure the following for the Y-axis.
- Count
- Sum
- Ignore
- Average
- Use the Source drop-down list to configure the mapping of the Y-axis as necessary.
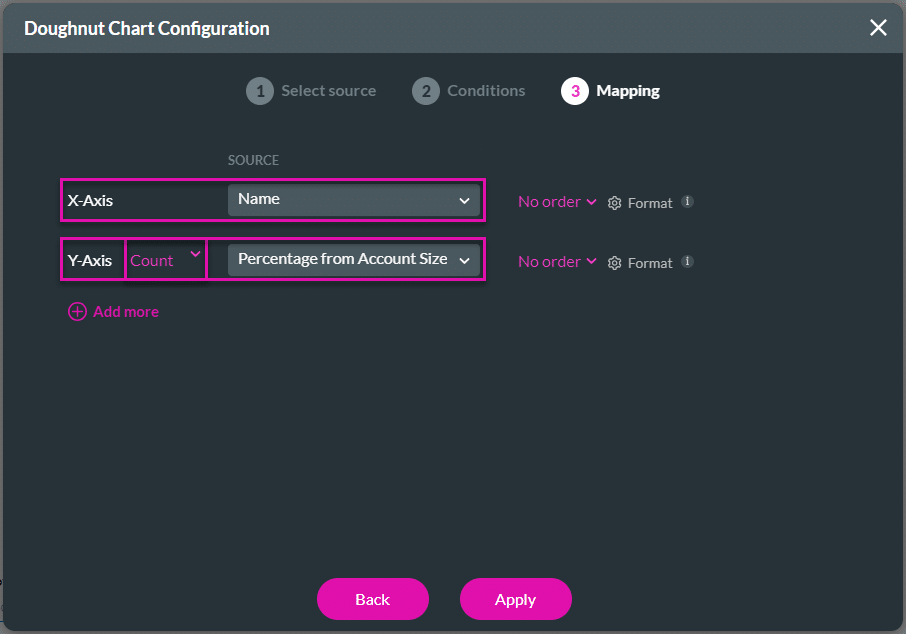
- Click the Add more option to add additional mapping.
- Additional mapping is used only for variables in chart tooltips.
- Use the Source drop-down list to configure the additional mapping.

- If necessary, click the Delete icon to remove a parameter.

- Click the Apply button. The doughnut chart is added to the canvas.

- Save and Preview the project.
Learn more about the doughnut chart settings.
Hidden Title
Was this information helpful?
Let us know so we can improve!
Need more help?
Book Demo