

Discover My Dashboard
What does the Dashboard Offer You?
The Dashboard allows you to view real-time data and provides an overview of your projects. Increase productivity as the dashboard provides multiple shortcuts to organize, find and manage projects.
How to Video
- 0:01 Introduction.
- 0:30 We show you how to view monthly data of API Calls, Document Generation, Storage Usage, List of Created Projects, and Types of Users.
- 1:00 Learn more about My Account; Profile view, company information, Billing, Professional services, My cases, and Environment.
- 2:20 Learn more about the setting.
How can you Navigate the Dashboard?
The dashboard is shown by default. Alternatively, you can click on the Platform menu to navigate to the Dashboard option or select the Dashboard tab.

How can you view your Current Account?
- View your Account’s Current Plan.
- Use the links to do the following:
- Select the upgrade here link to change your plan type and increase your account limits.
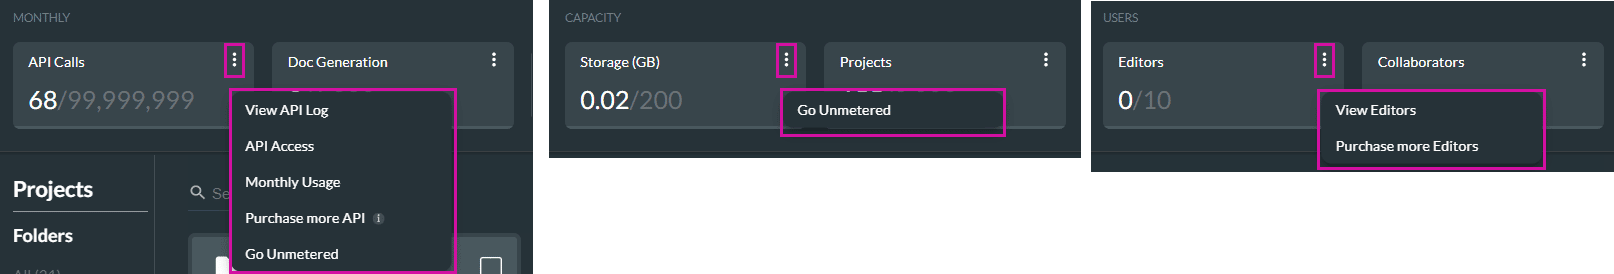
- Use the To go unmetered option if you have fluctuations in your usage on the app. This prevents your account from being blocked if you exceed your quota in specific circumstances.

How can you view your Statistics?
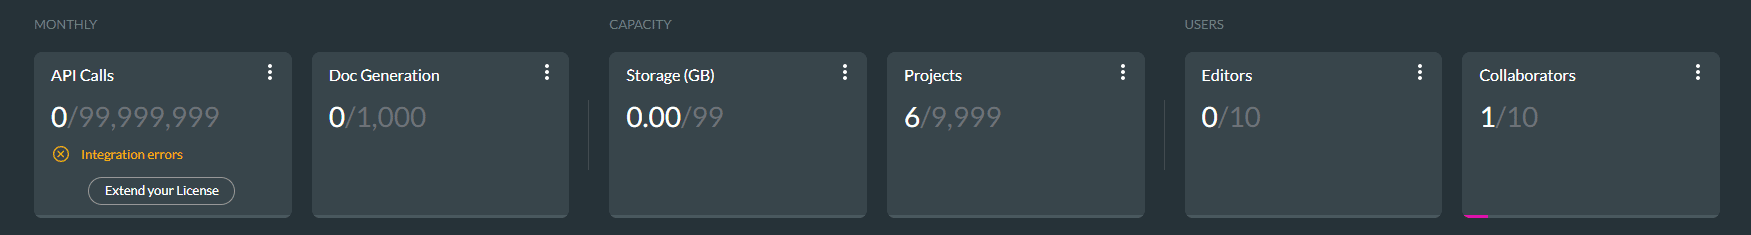
- Use the Dashboard to view multiple data reports such as:
- API Calls: this is the number of monthly API calls consumed by your project within the current month. Depending on your contact, it displays as a number of the API calls used out of your monthly quota, for instance, 45/50 000.
- Document Generation: this is the number of documents you have generated on a monthly basis out of the quota you have.
- Storage Usage: this is the size of the data you are storing on Titan.
- List of Created Projects: this is the number of Titan projects you have. Depending on your contact, it displays as a number out of the allowed contact number, for instance, 145/9 999.
- Types of Users: this displays the users configured.
- Editors
- Collaborators
- Click the Kebab icon on each data folder to view more options (the options differ according to your selection), such as:
Find out how to Navigate your Projects.
Hidden Title
Was this information helpful?
Let us know so we can improve!
Need more help?
Book Demo