
Debug Mode
Business Background
Debug mode is a special operating mode designed for developers and testers to identify, diagnose, and fix issues or errors in the software. It provides additional tools, information, and features that help debug or troubleshoot problems during development or testing.
Titan Solution
With Titan, you can view the values of the elements added to the project, such as variables and other data. Debug mode is only available when a project is previewed.
You download a debug CSV file to use the full range of Excel’s analytical tools.
How to Guide
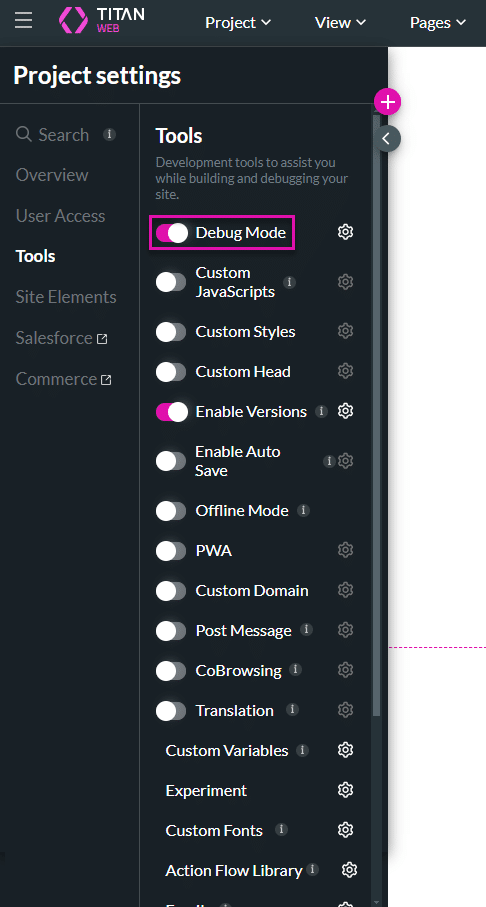
- Click the Gear icon to open the Project settings.
- Select the Tools option. The Debug Mode toggle switch is on by default.
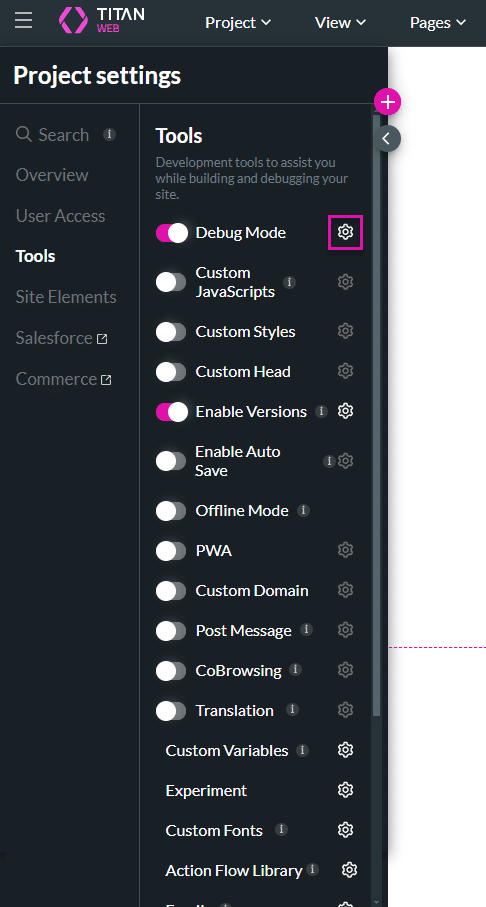
- Click the Gear icon. The Configure Debug mode settings screen opens.
- If required, click the Skip validation checkbox.
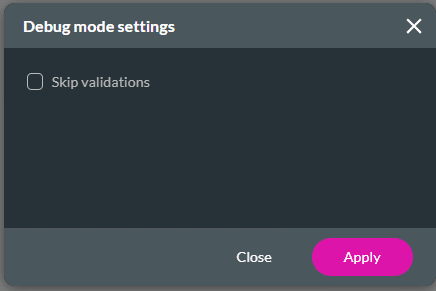
Use the Skip validations checkbox when you want to ignore any validations on the project. For instance, when testing an element that has any type of validation rule configured, such as a stepper with mandatory fields, the validation will be ignored and the subsequent steps can be viewed.
Any Salesforce push integrations will run without being validated.
- Click the Apply button.
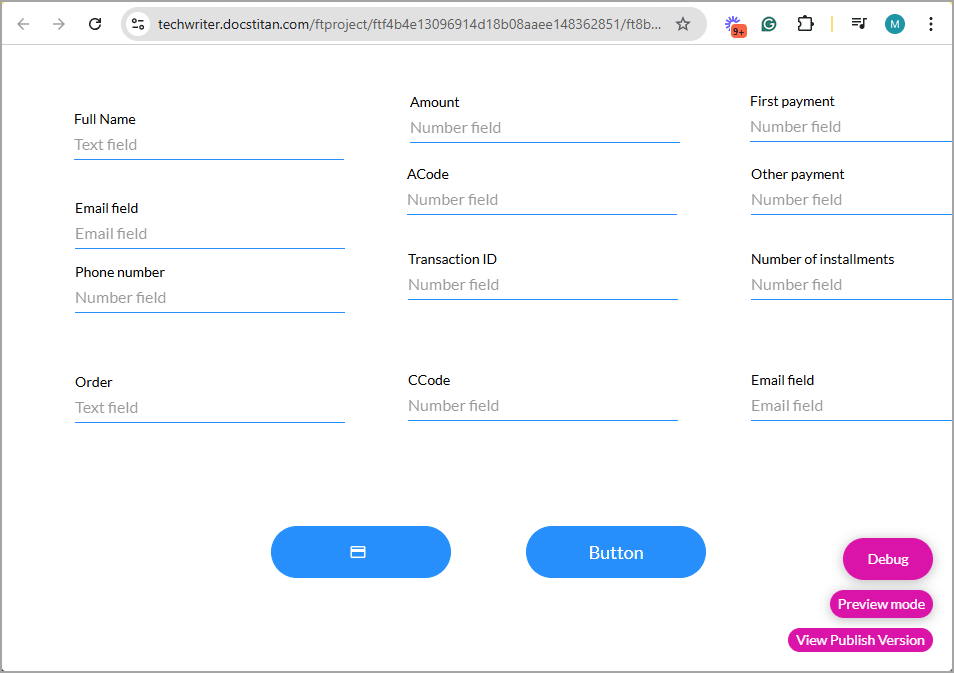
- Save and Preview a project. The Debug button is displayed in the bottom right corner.
- This button is only shown for the project preview.
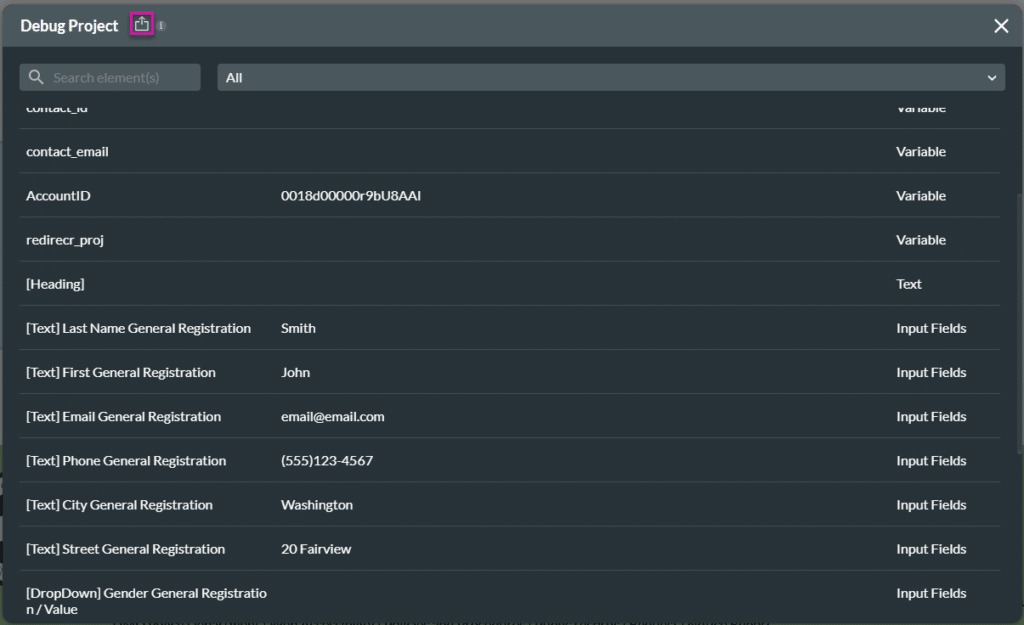
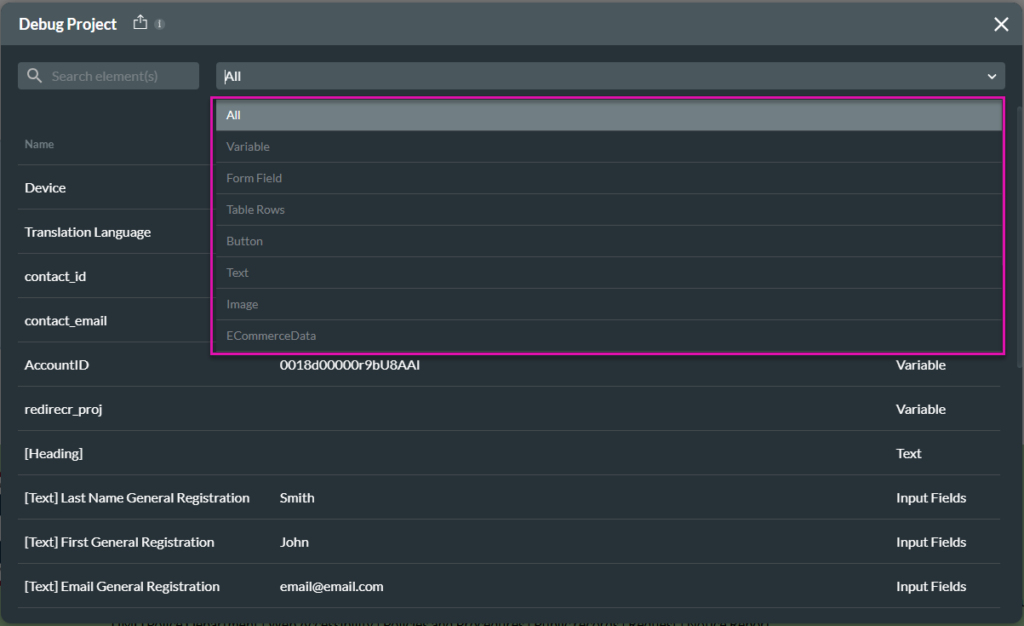
- Click the Debug button. The Debug Project screen opens.
- This screen shows every element, widget, table, field, variable, and so on that exists on the project’s current page.
- Project-level information can also be seen.
- SmartV information can be seen on the debug screen.
- Use the drop-down list to view specific elements.
- Alternatively, use the Search element field to search for specific Titan Web elements.
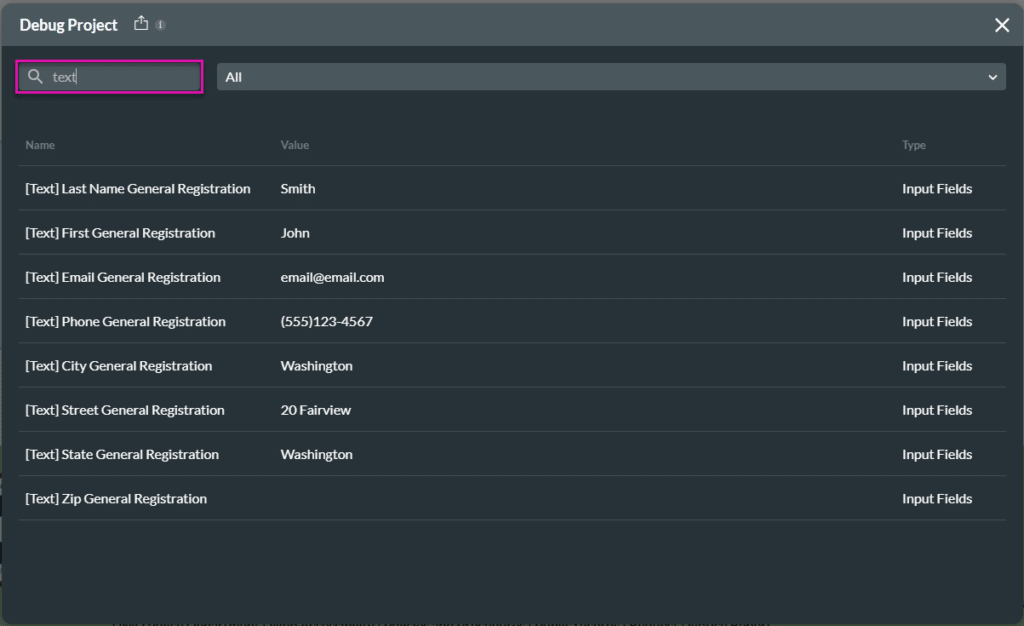
- Click the Export icon to export the debug details to a CSV file.