

Use Charts as Power Table Subcomponents
Business Background
Use a chart as a power table subcomponent, in Titan Web.
Titan Solution
- Titan Web offers your business the option to use a chart as a power table subcomponent with no code.
- You can style the chart’s width and height.
How to Video
Video Coming Soon!
How to Guide
You can add a chart as a sub-component when creating a power table.
Set the height and width of the chart.
- Select the expand (+) icon next to the settings icon in Titan Web. A list of elements will show.
- Select the Table option from the list.
- Select and drag the Power Table element to the canvas.
- Configure the Salesforce integration.
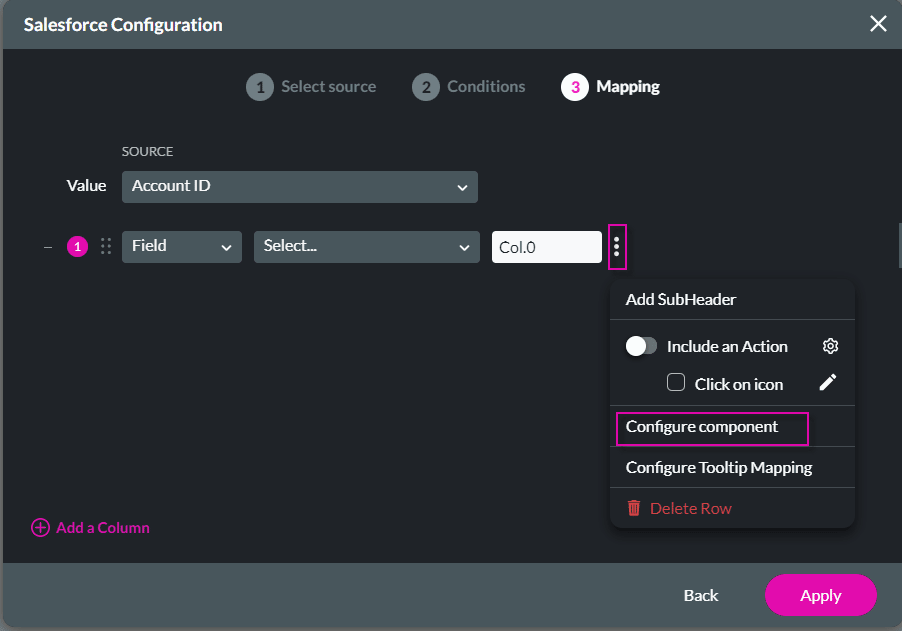
- Select the Kebab button under Mapping. A pop-up opens.
- Select the Configure component option.
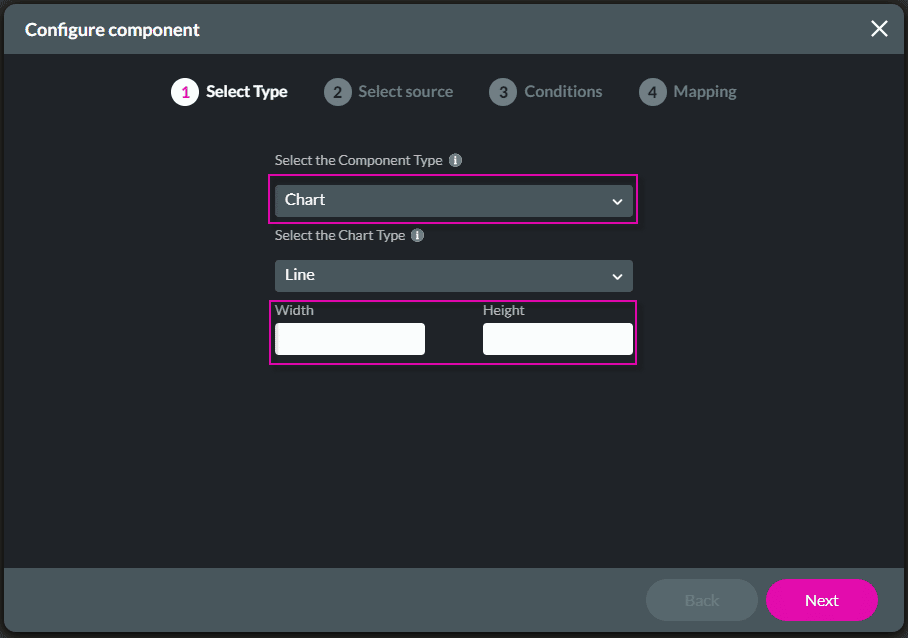
- Select the Chart from the drop-down list. The screen changes, and you can set the width and height of the chart.
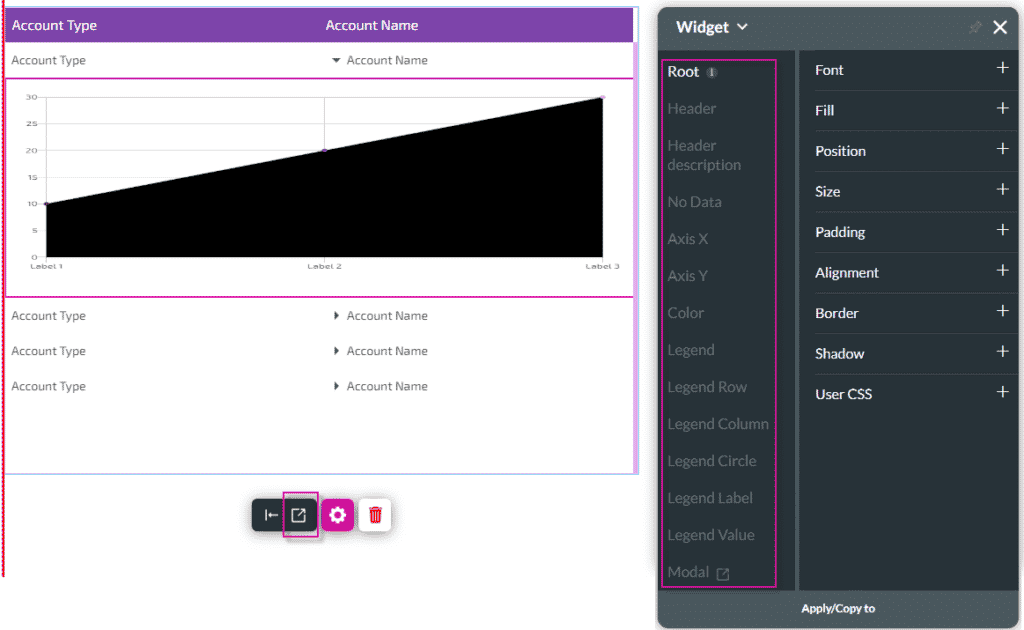
- Select the chart sub-component and select the Style icon of the chart.
- Use any option to style the chart subcomponent.
Hidden Title
Was this information helpful?
Let us know so we can improve!
Need more help?
Book Demo