

Live Trace
Business Background
View the integrations done on your Titan account for analyses and debugging, and the reason for many API calls.
Titan Solution
- Live Trace lets you capture (in the background) all integrations done on your Titan account for a period of four hours.
- The integrations are seamlessly exported to Google Drive for easy analyses or debugging. You will also be able to see the reason for many API calls.
How to Video
Video Coming Soon!
How to Guide
Enable Live Trace to capture (in the background) all integrations done on your Titan account for a period of four hours. (It will automatically be disabled after four hours.) This only applies to products in Production (not in a testing environment). You can download the log file as a .csv file and use it to debug errors or see issues that cannot be reproduced in the testing environment. You can analyze the downloaded file in Excel, Google sheets, or a similar application.
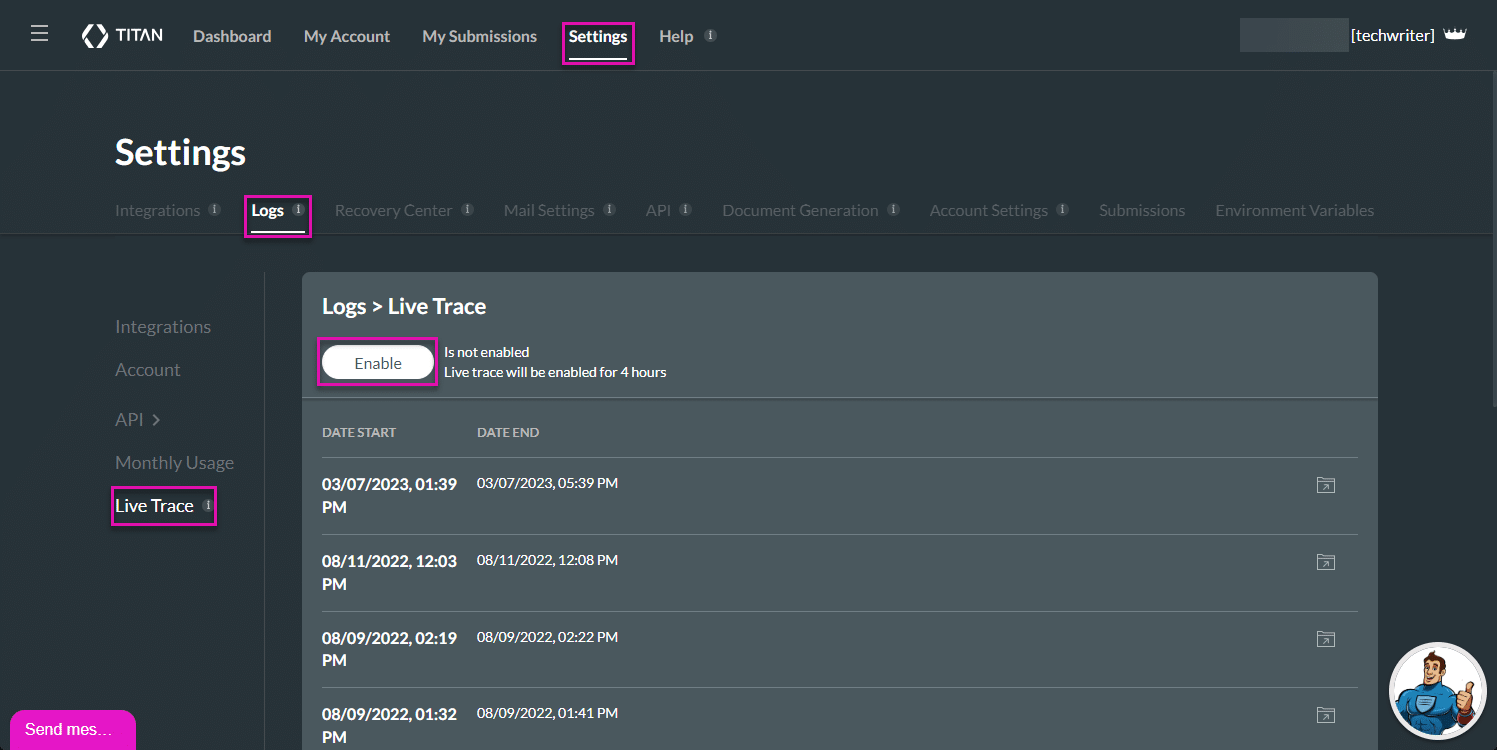
- Select the Settings option and navigate to the Logs option.
- Click the Live Trace option.
- Click the Enable button and let Live Trace run. Live Trace will run for four hours and then automatically stop.
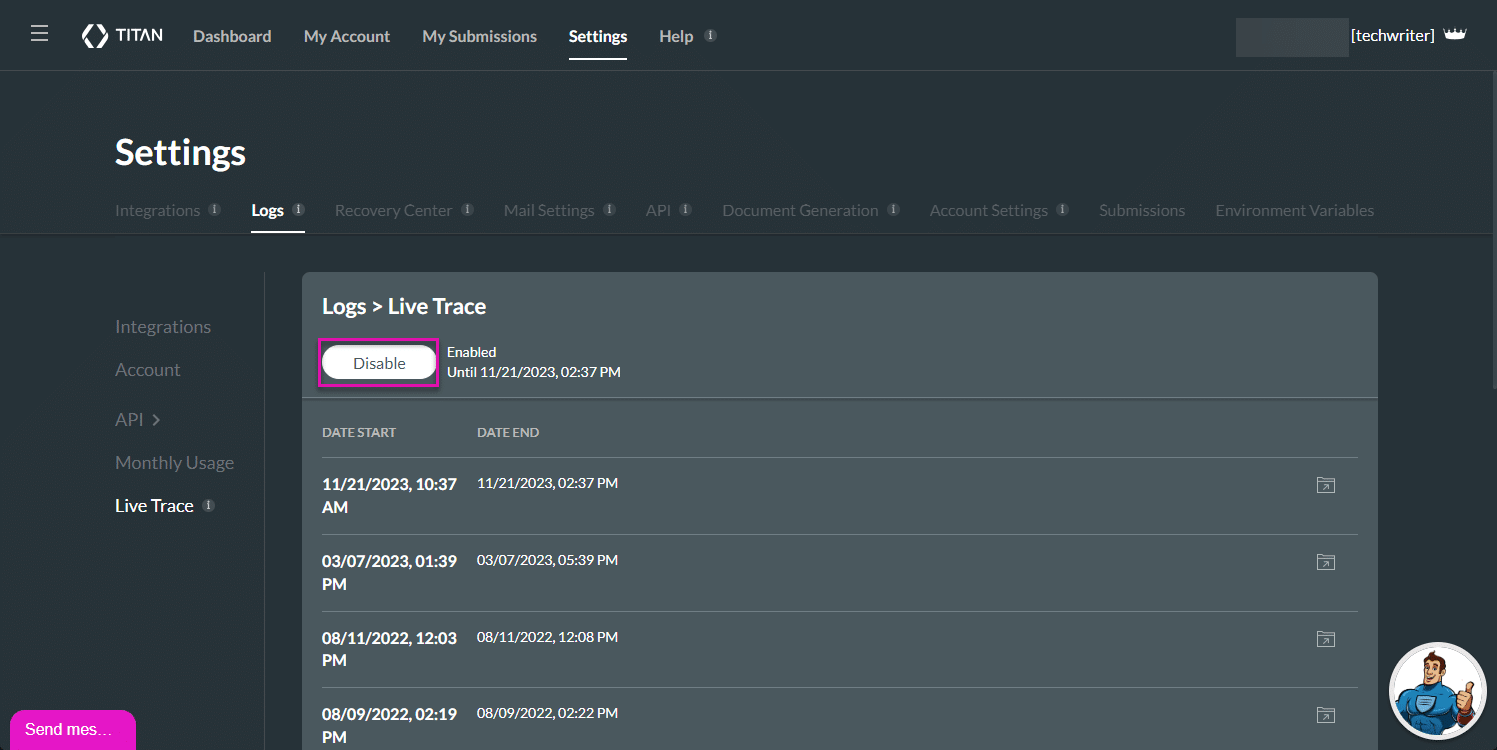
- Click the Disable button if four hours have not passed. The start and end dates and times are shown.
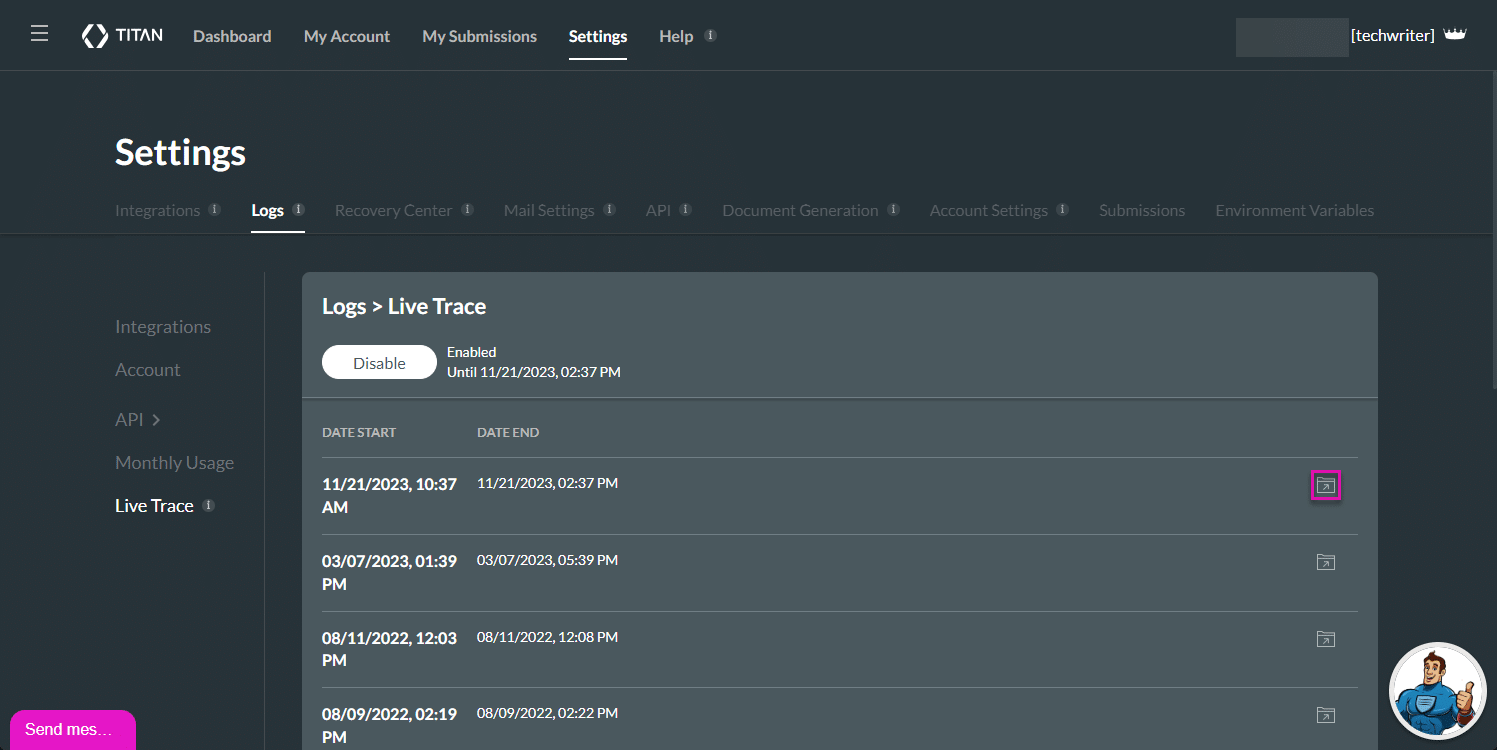
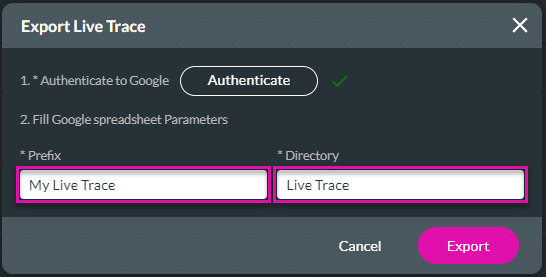
- Click the Download file icon on the right of the block. The Export Live Trace screen opens. The file can be big after four hours and will be exported to your Google Drive.
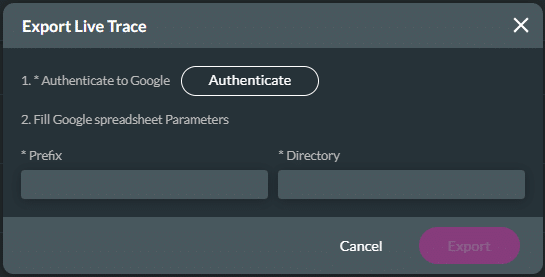
- Click the Authenticate Google button. The standard Google Sign-In screen opens.
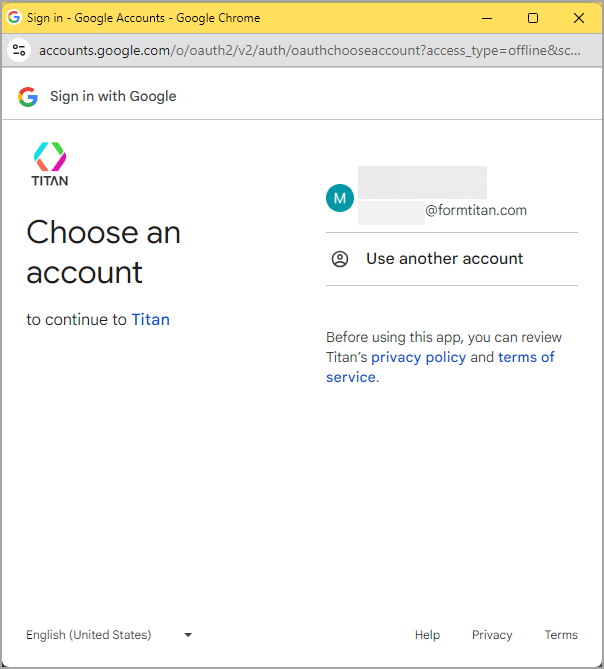
- Select the account that you want to use to sign in to Google. The standard Google sign-in screen opens.
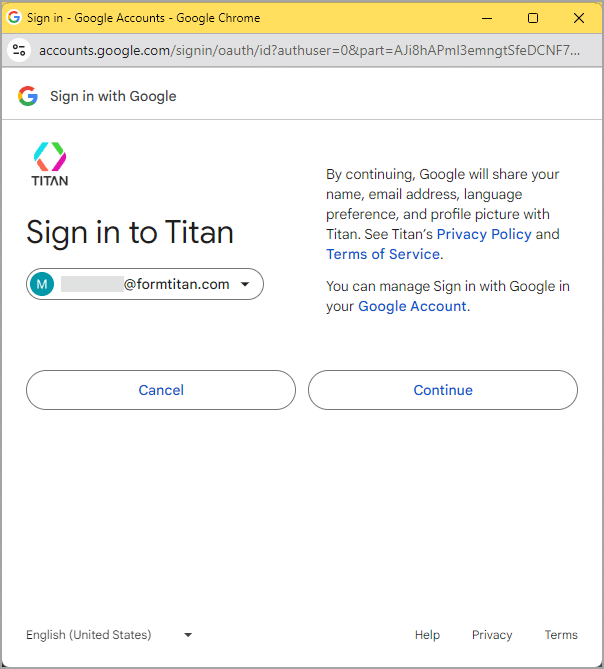
- Click the Continue button.
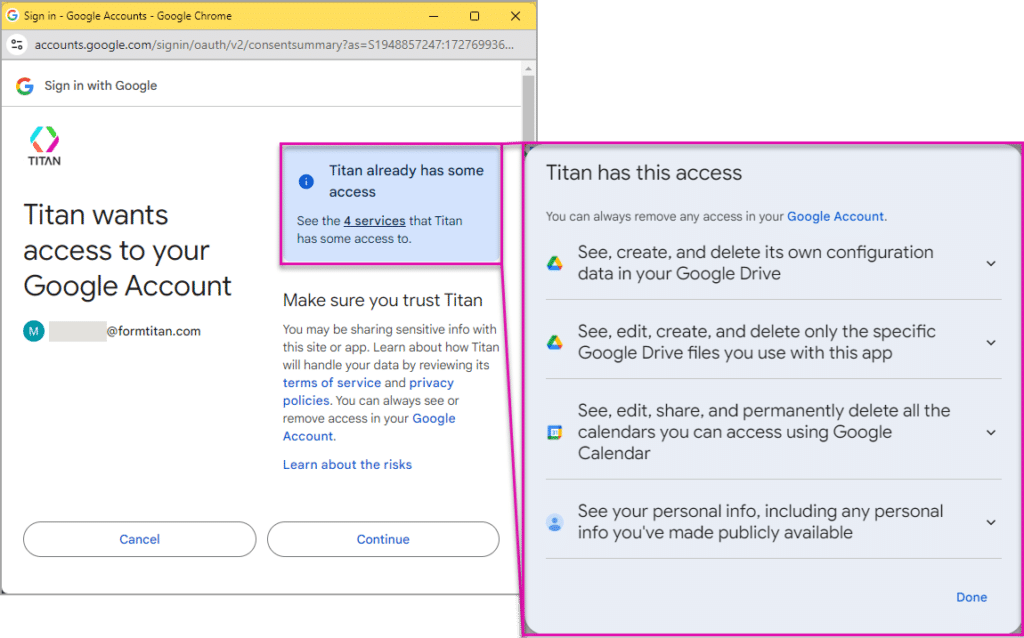
- Scroll down the page and click the Allow button.
- Add a prefix in the field. This is the name of the document.
- Add the directory in the field. If this directory doesn’t exist, Titan will create the directory on your Google Drive.
- Click the Export button. A message will be shown: “Success. Your data is being exported.”
If the export file is empty, you will see the following message: “Error. File is empty. Nothing to export”.
- Browse to your Google Drive.
The exported file will be added to the folder on your Google Drive.
Use the data to analyze, debug, and reason for many API calls. An API call is logged for each integration action between Titan and Salesforce. You can use any of the standard spreadsheet filters to filter the data.
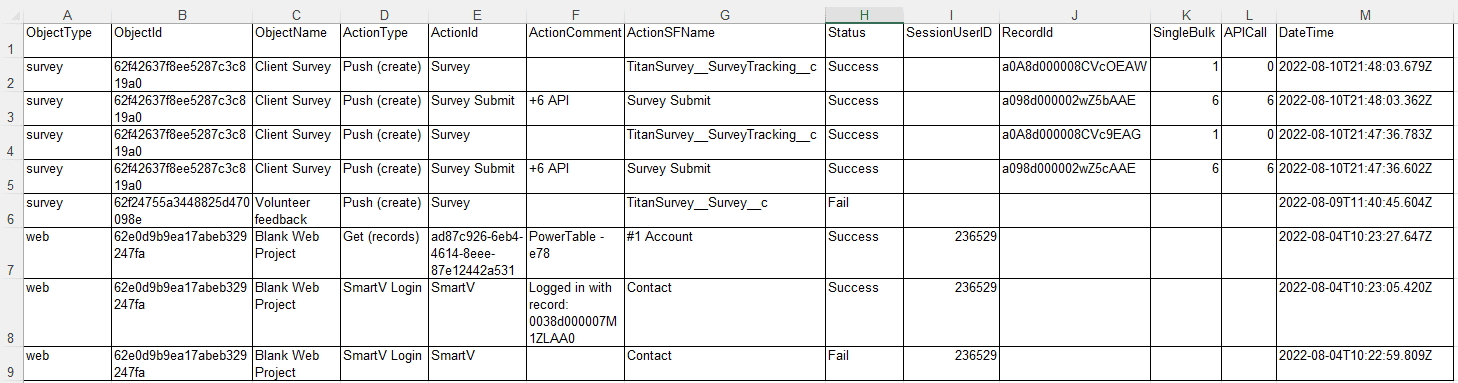
| Column A | This is the Titan project. |
| Column B | This is the ID of the project in the Titan builder.
|
| Column C | This is the name of the Titan project. |
| Column D | This is a description of the type of integration action that occurred. |
| Column E | This is the ID of the integration action. Project Settings > Salesforce > Records 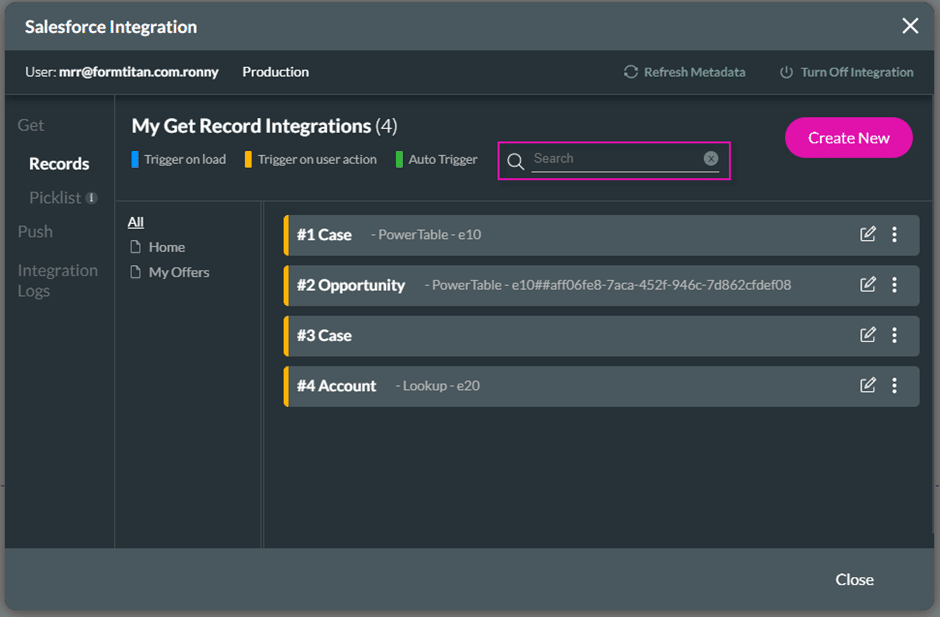
Copy the integration ID and paste it in the Search field. The relevant record will be shown. |
| Column F F | This is the system comment or the description on the Map Salesforce fields screen. It is best practice to add a description on the screen as it may help you in recognizing the integration action. Project Settings > Salesforce > Records > Edit a record 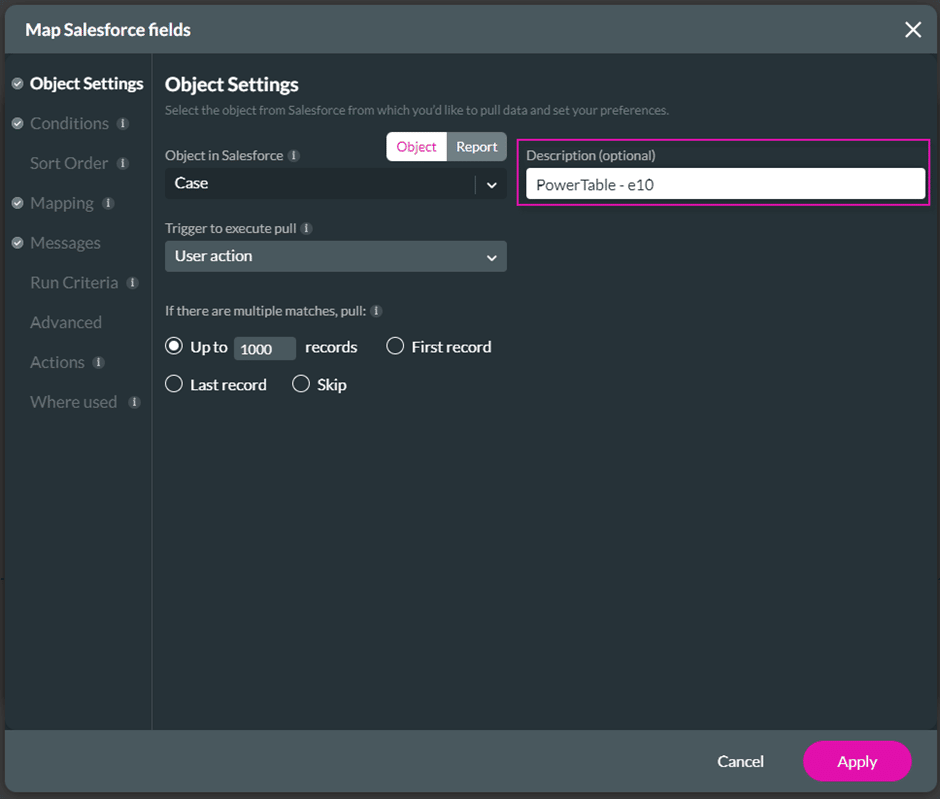
|
| Column G | This is the record on the Salesforce Integration screen. Project Settings > Salesforce > Records 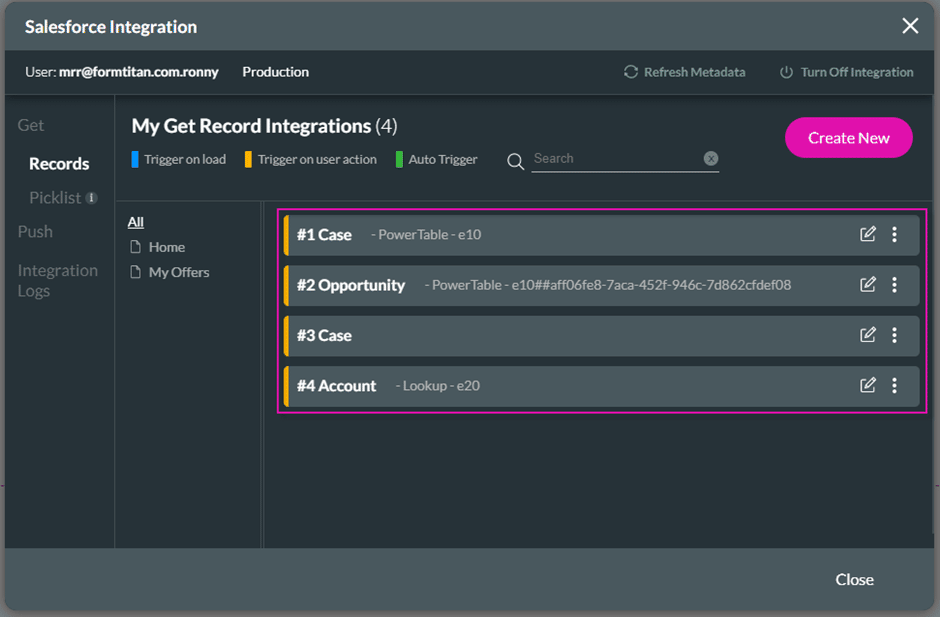
|
| Column H H | This gives a descriptive error message from Salesforce if the status in Column I is Fail. |
| Column I | This describes the status of the action type that happened in Column D. If the action failed, the error message will the shown in Column H. |
| Column J | This is the session user ID. This lets you sort results per unique user per session. |
| Column K | This shows whether there was a single update or bulk updates. For single updates, the column will show 1. For bulk updates, the number of updates will be shown. |
| Column L | This shows the number of API calls. |
| Column M | This is the date and time of the integration action and is sorted using the timestamp with the latest action by default at the top. |
In this example, please refer to the SmartV lines:
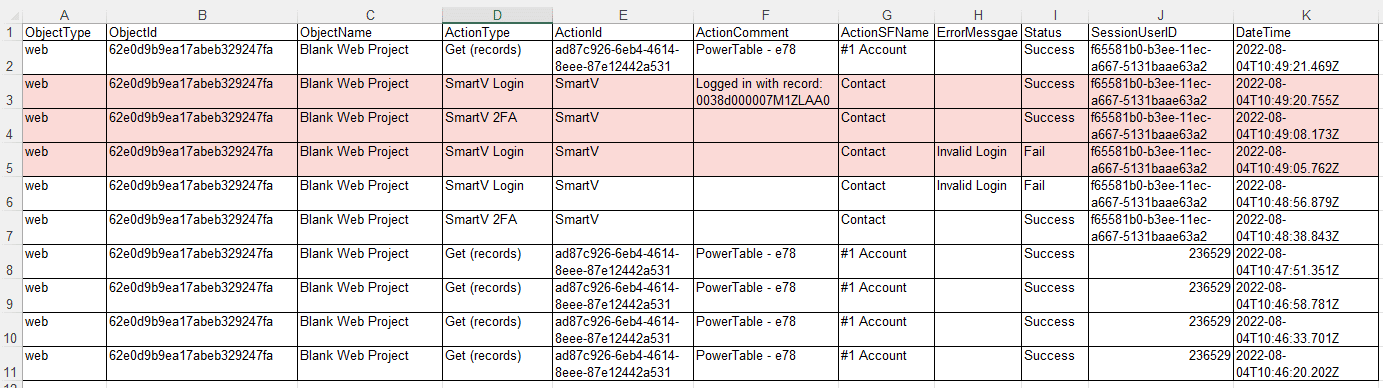
Action type column shows that there were the following SmartV actions:
- Line 5: Invalid SmartV login – a user used invalid login details and the action failed.
- Line 4: SmartV 2FA action – a user supplied a valid 2FA code.
- Line 3: Successful SmartV login. In the Action Comment column (F), you will see the comment: “logged in with record” and record ID. A user logged in with valid details, and the record ID is supplied.
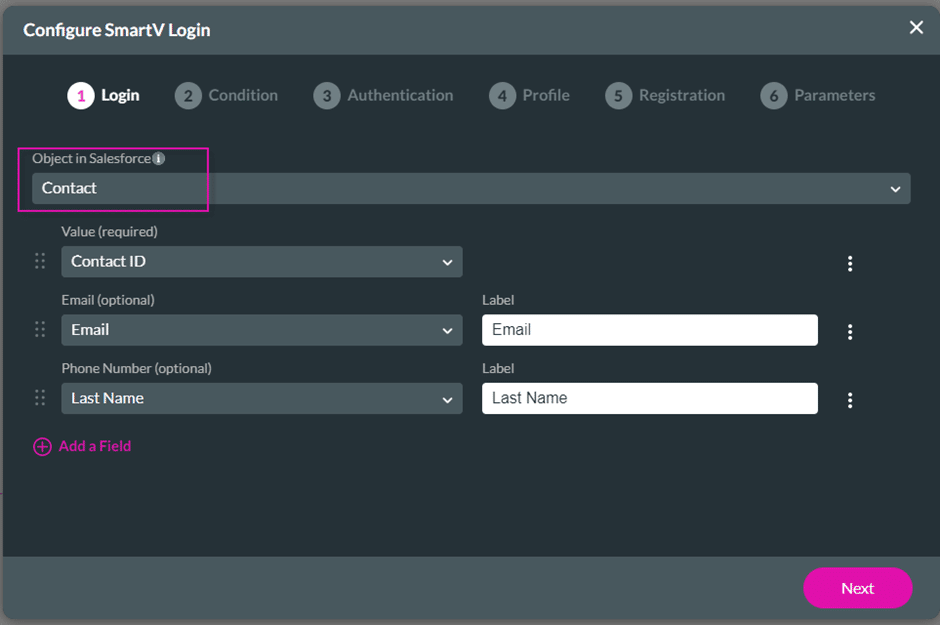
In this example, column G refers to the Salesforce object that was used when doing the SmartV configuration:
In this example, please refer to the Survey lines:
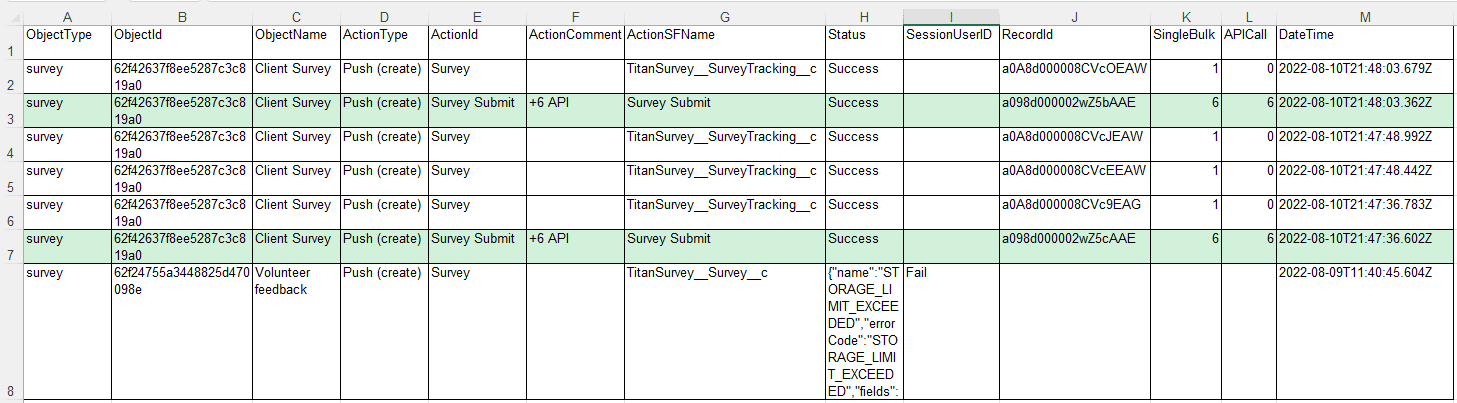
The API calls per submitted survey are shown in the Action Comment column (F) as well as the APICall column (L).