

Questions Responses Analysis
For more information on the dashboard for the Titan Analytics for Salesforce, click here.
Click here for more information on Salesforce reports and dashboards.
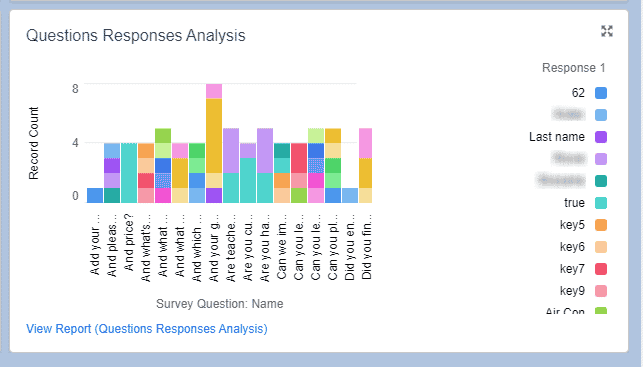
On this dashboard panel, you can see the questions responses analysis. The Y-axis shows the Record Count, and the X-axis shows the Survey Question. The responses are shown in the top right corner.
- Click the View Report (Question Responses Analysis) link to open the report.
- Use the Filters at the top right of the report to filter the results as follows:
- Show Me
- Date Completed
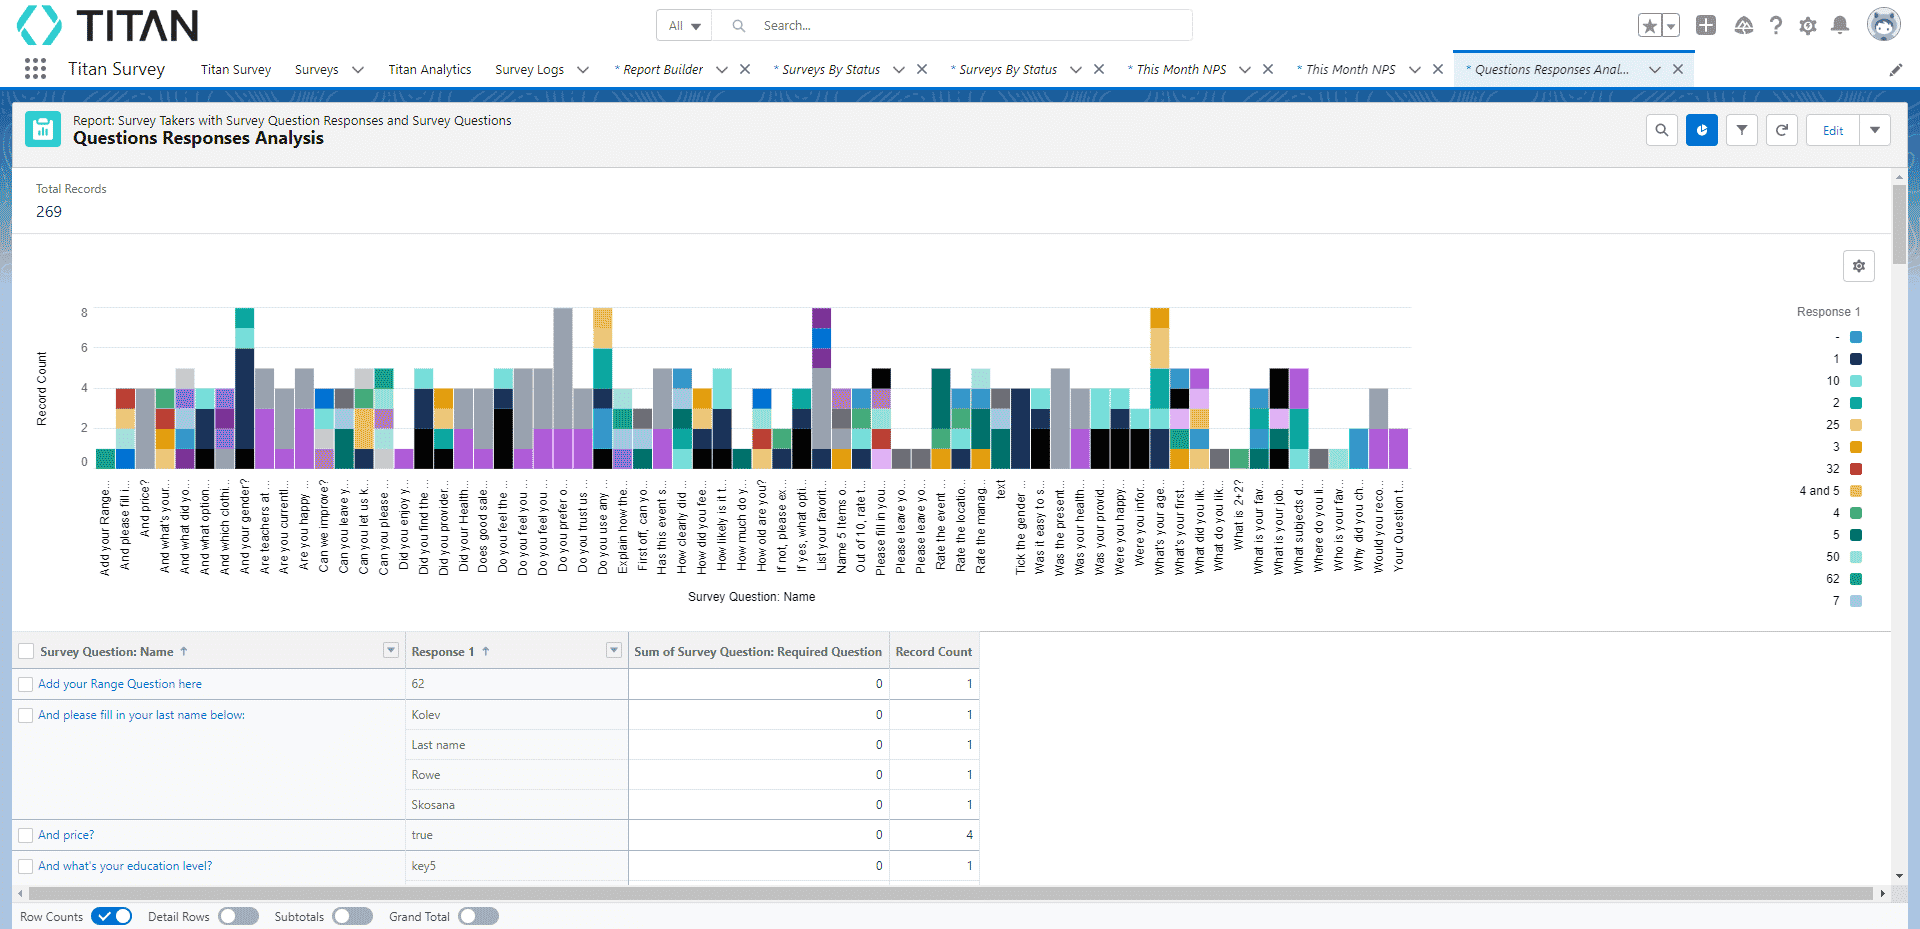
- Scroll down the report to see more information.
Hidden Title
Was this information helpful?
Let us know so we can improve!
Need more help?
Book Demo